Why understanding Trendline is important?
Whenever we see the price chart of any stock or security, we always see it may be rising or declining. Price fluctuations are common on the chart, regardless of the time window we used.
This price trend refers to the variation of price over a specific time. means here we can say that the price direction indicates the trend. For example, if the price is rising upwards, it is called an uptrend, if it is falling, it is called a downtrend, and we use the trend line tool to understand this price trend or price direction and its specific entry-exit points.
It is important to understand the trend line because it not only shows us the overall trend of the price, but at the same time, we get the upper and lower points or peaks of price, which makes it easier for us to decide to make the right entry and exit. With the help of these points, we may limit or reduce our losses and trade more profitably.
What is a trend line?
A trend line is a straight line drawn or plotted by connecting at least two or more price peaks.
There are primarily two types of trendlines: uptrend line and downtrend line.
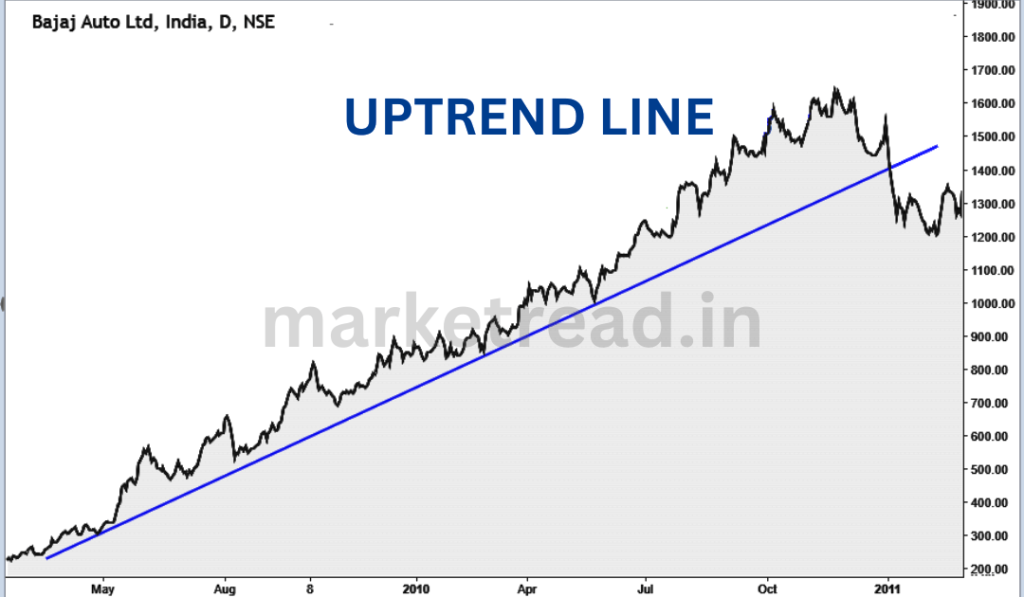
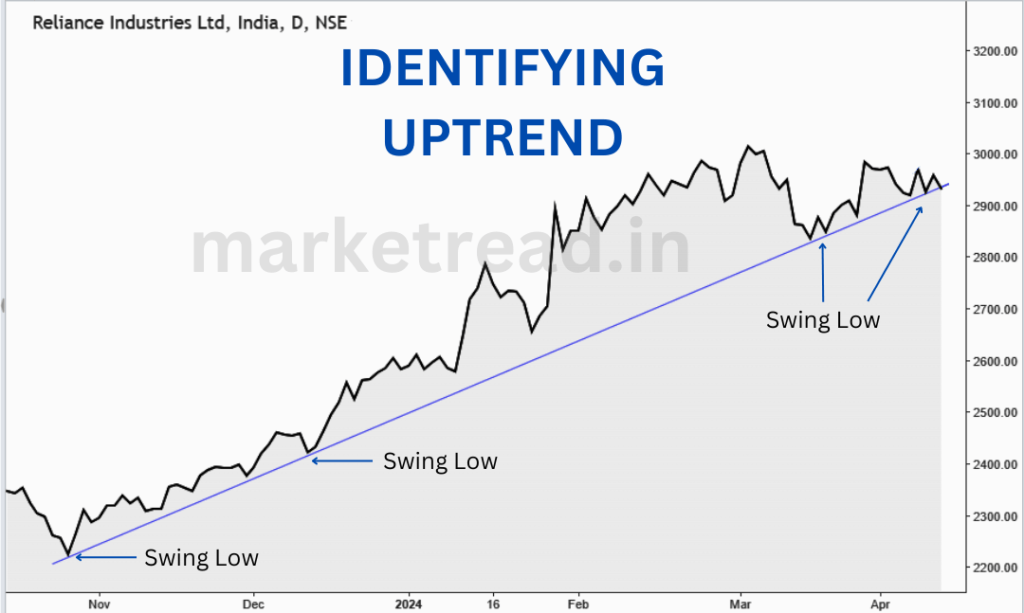
- An uptrend line is formed by connecting lower peaks (Higher Lows) which indicate an upward trend. You can see this in the Chart 01.
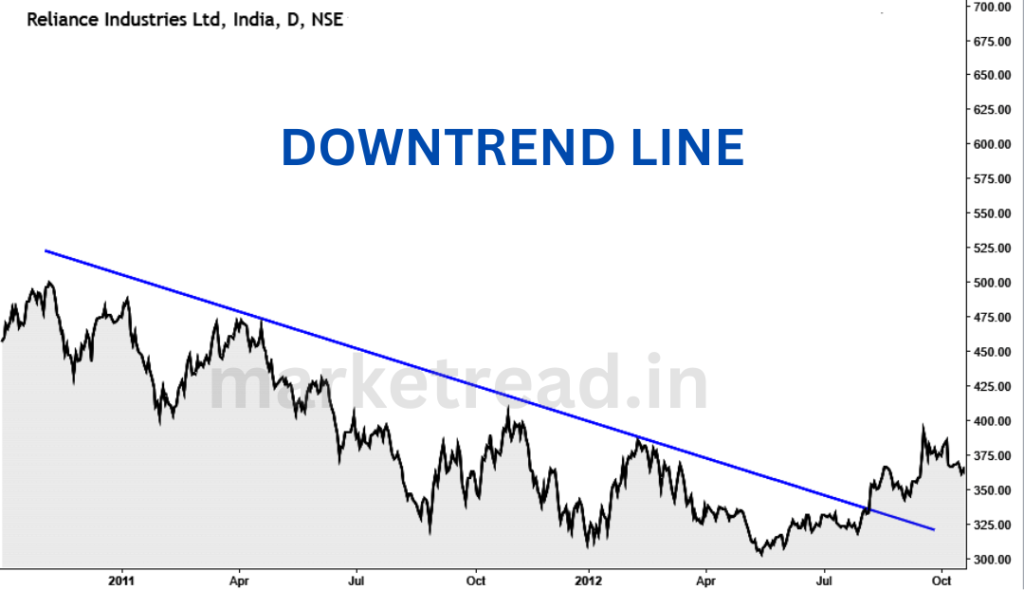
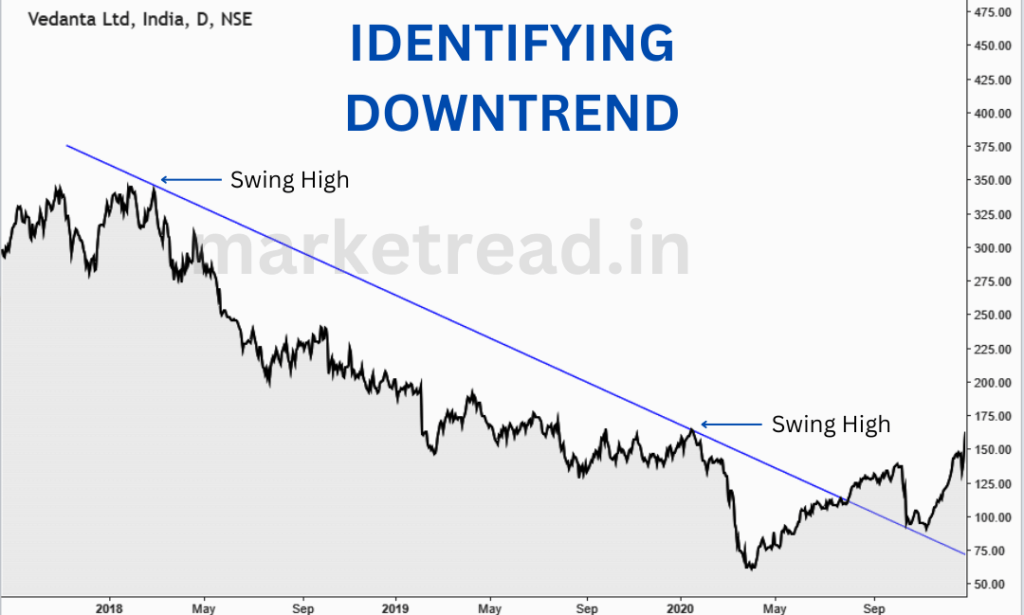
- Similarly, a Downtrend line is formed by connecting higher price peaks (Lower Highs) indicating a downward trend. See Chart 02.
The trendline becomes stronger as more price peaks are connected. The trend line not only represents the overall price movement, but it also serves as support and resistance to the price. They are also known as support and resistance trend lines.
For example, if the price is in an uptrend and eventually approaches the uptrend line by falling, the price may reverse. According to trading psychology, the majority of traders are looking for buying opportunities at that price range. And when the price comes to the trendline, they prefer to buy.
In contrast, if the price is in a downtrend and climbs upward, the downtrend line serves as resistance, and traders search for selling opportunities in this price range.
How are trends identified?
As we already know, the direction of the price indicates the overall trend. However to understand the exact movement in the price we need to use a trend line.
If the price is moving upward, we draw a straight line on the chart linking the lower price peaks (Higher Lows). Here we have an uptrend line. Similarly, when the price declines, we connect the upper peaks (Lower Highs) to form a downtrend line.
According to the rules of drawing a trendline, it is considered acceptable only if it is drawn by connecting at least two price peaks. If the trendline connects more than two points, it is considered more reliable. Trend lines not only help us to understand the price trend but also help us to find important high and low points. Based on this information we can decide, where to buy or sell stocks or securities in the right price zone.
How are Trendlines drawn?
To draw a trendline, first, we have to look at the chart closely and understand the overall trend in price. This means you have to see if the price is rising or falling. After you need two determining points — a minimum of two established Top Reversal points to fix a Down Trendline and two established Bottom Reversal points to fix an Up Trendline.
As you can see in Chart No.03, there are 4 swing lows of the price. So now choose the right price point according to what you see on the chart: and connect a swing low with a trendline tool.
If the price is falling then choose a swing high. These points should be clear and well-defined on the chart. See the Chart No.04.
After that, with the help of the trend line tool, draw a straight line connecting the points. Which passes touching those points. An important thing to keep in mind here is that the line should not intersect with any other price bar or candles.
The more times a price touches or respects the trendline, the more valid it is.
Along with this, we must know what the slope is like. This means that the slope of a trendline might reveal extra information about the intensity and direction of the trend. A steep upward slope denotes a strong uptrend, while a steep downward slope suggests a strong downturn. In contrast, a shallow slope suggests a weak or slow trend.
Now we have to remember that just because we have drawn a trendline by connecting the price points doesn't guarantee that it will never break or will remain constant forever. So it is also important to see that whenever there is a change in the price, the trendline also has to be adjusted as per the price movement.
If the price breaks the trendline, it is a sign that the trend is losing its strength or a sign of a reversal.
Therefore, it is important to check the trendline always and adjust it if necessary.
To make the trendline more reliable and effective, we can also use additional technical tools along with the trendline, Such as moving averages, oscillators, and volume indicators.
Drawing trendlines accurately requires practice and experience. As you learn and understand more about various market conditions and price patterns, you will become better at identifying the most important price points and drawing trend lines that accurately represent the trend.
Importance of Time frame while using Trendlines
The timeframe is crucial to understand the overall price trend. Let's assume we're looking at a chart over a 5-minute or 15-minute time frame. we may see a price decline, but as we extend the timeframe, we begin to see an overall trend.
If you are a day trader, then it is obvious you might work on smaller time frames, but if you want to understand the overall trend in price, we must look at it on longer time frames. The second important thing is that trend lines formed on larger time frames are more reliable than those formed over shorter timeframes.
Also Learn This: What is Technical Analysis?
Also Learn This: Nature and Anatomy of Candlestick
Conclusion
Trendlines help us to identify the trend of price. Consistent practice and experience are key to drawing accurate and effective trendlines. By understanding price patterns and market conditions, you'll improve your ability to identify key price points and draw trendlines that accurately reflect the underlying trend.
To understand more about Trendline refer: Wikipedia
FAQs
Why are Trendlines Important?
Trendlines help visualize the prevailing trend (upward or downward) of a stock or security price. By understanding support and resistance levels, traders can potentially limit losses by exiting positions before significant price drops.
Types of Trendlines?
Up Trendline: Connects a series of higher lows, indicating an upward price movement.
Down Trendline: Connects a series of lower highs, indicating a downward price movement.
How to Draw Trendlines?
Analyze the price chart to understand the overall upward or downward direction. Select at least two swing lows (uptrend) or swing highs (downtrend) that are clear and well-defined. Use a trendline tool to draw a straight line connecting the chosen points.
How many points are needed for a trendline?
A minimum of two price points is required, but more points create a stronger and more reliable trendline.
What happens when a trendline breaks?
A break of the trendline (price moving through it) can signal a weakening trend or a potential trend reversal. It's important to monitor price action after a break to confirm the change.
Do trendlines guarantee future price movements?
No, trendlines are not foolproof. Prices can deviate from the trendline, and false breakouts can occur.
What timeframe should I use for trendlines?
The timeframe depends on your trading style. Day traders might use shorter timeframes, while long-term investors might focus on larger timeframes for a broader perspective. Generally, trendlines on longer timeframes tend to be more reliable.