Market News
Feb 24, 2026
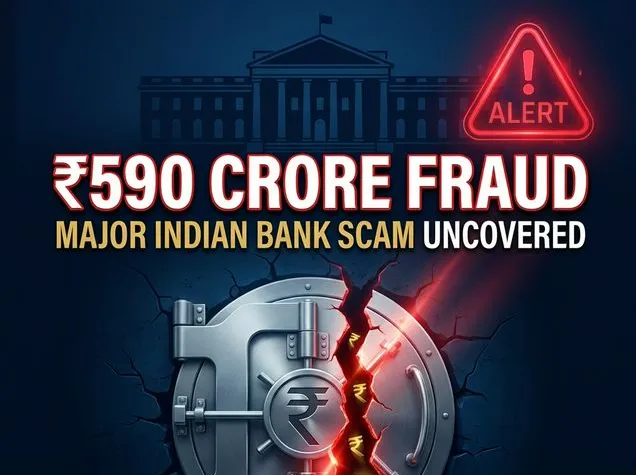
IDFC First Bank's ₹590 Crore Haryana Fraud: What Really Happened and What It Means for Investors
An analyst's deep dive into the IDFC First Bank ₹590 crore Haryana government account fraud. How it happened, what it means for investors, and what India's banking sector must fix.