
This article explains What is P Values, a statistical measure used to assess the significance of data in hypothesis testing. P-values represent the probability of obtaining observed results if the null hypothesis (the initial assumption) were true. A lower p-value indicates stronger evidence against the null hypothesis, with a value below 0.05 often considered statistically significant. The article details how p-values are calculated, interpreted, and used to compare different results, providing examples from investment analysis. It emphasizes that p-values, while helpful, don't offer conclusive proof but are valuable for evaluating the strength of evidence.
You will love this if you are a serious trader. Download Candlestick Pattern Cheat Sheet
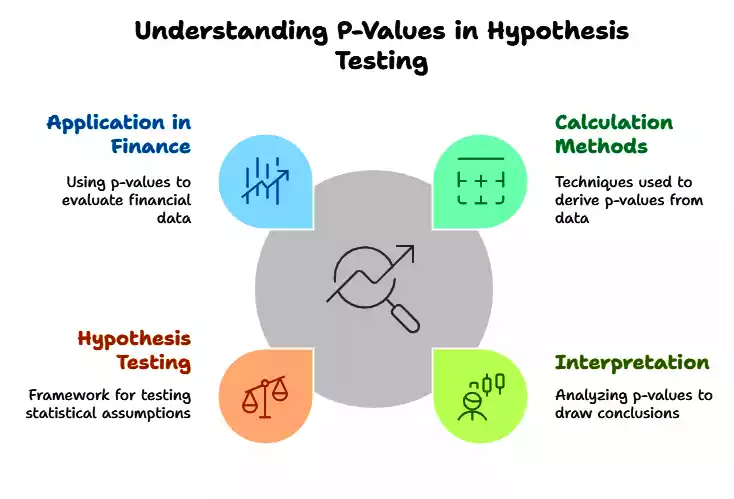
Here we will look for the topic of p-values, a crucial concept in statistical hypothesis testing. It explains what p-values are, how they are calculated, their uses, and how to interpret them in research and analysis, particularly within the context of finance and investment. The article emphasizes the role of p-values in assessing the credibility of claims and the statistical significance of observed data.
So, What is P Value, Really?
- A p-value is a "number describing the likelihood of obtaining the observed data under the null hypothesis of a statistical test."
- It’s a probability, indicating how likely it is to observe the given data (or more extreme data) if the null hypothesis is true.
- It is a measure of the evidence against the null hypothesis.
- "A p-value, or probability value, is a number describing the likelihood of obtaining the observed data under the null hypothesis of a statistical test."
Why Should You Care About P-Values?
- P-values are used to assess the statistical significance of observed results.
- They provide a standardized method for determining whether to reject a null hypothesis.
- They are frequently used in scientific and medical studies, as well as government reports, to bolster credibility.
- For instance, "the U.S. Census Bureau stipulates that any analysis with a p-value greater than 0.10 must be accompanied by a statement that the difference is not statistically different from zero."
- They allow for comparison of results across studies that may use different confidence levels by enabling a reader to independently interpret statistical significance.
- "P-value is often used to promote credibility for studies by scientists and medical researchers as well as reports by government agencies."
How Do You Even Calculate a P-Value?
- P-values are usually calculated using statistical software or p-value tables.
- They rely on the probability distribution of the specific statistic being tested.
- They are calculated based on the deviation between an observed value and a reference value.
- "The calculation for a p-value varies based on the type of test performed: lower-tailed test, upper-tailed test, or two-tailed test."
- The general concept is that the greater the difference between values, the lower the p-value.
- In essence, the calculation involves "integral calculus from the area under the probability distribution curve..."
P-Values and Hypothesis Testing—Best Buds
- Hypothesis testing involves a null hypothesis (initial claim) and an alternative hypothesis.
- A p-value is used to decide whether to reject the null hypothesis.
- "The p-value approach to hypothesis testing uses the calculated probability to determine whether there is evidence to reject the null hypothesis."
- A smaller p-value suggests that there is more evidence against the null hypothesis.
- Researchers predefine a significance level to determine the threshold of p-value required to reject the null hypothesis.
- The common benchmark is 0.05.
How to Read a P-Value Like a Pro
Interpreting p-values is where the magic happens. A p-value of 0.05 or lower is the gold standard—it’s “statistically significant,” meaning there’s strong evidence to reject the null. A p-value of 0.001? That’s even better—just a 1 in 1,000 chance the data’s a fluke. But if it’s higher, like 0.10, there’s not enough juice to say your results aren’t random. The guide warns, “Even a low p-value is not necessarily proof of statistical significance,” because chance can still play tricks. You’ll need repeat tests to be sure.
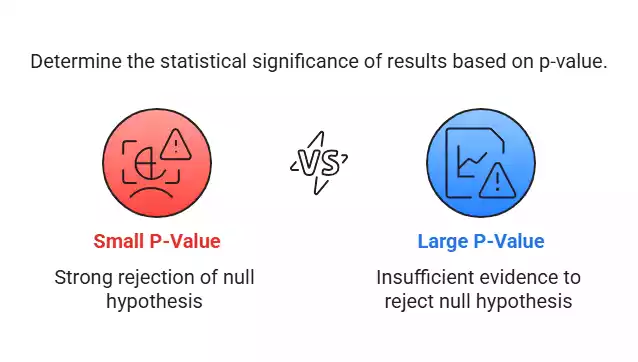
- A small p-value (e.g., 0.05 or lower) is considered statistically significant. It suggests a strong rejection of the null hypothesis.
- A large p-value (e.g., greater than 0.05) indicates that there is not enough evidence to reject the null hypothesis.
- "A p-value of 0.05 or lower is generally considered statistically significant."
- A p-value of 0.001 is stronger evidence against the null hypothesis than 0.05, since it indicates a 1 in 1000 chance of seeing the data observed if the null hypothesis was true.
- Importantly, "Even a low p-value is not necessarily proof of statistical significance, since there is still a possibility that the observed data are the result of chance."
- Repeated experiments or studies are needed to definitively confirm a relationship.
P-value approach to hypothesis testing:
- The p-value is often reported instead of a binary accept/reject decision based on a chosen significance level.
- This is because researchers may use different confidence levels when examining a question.
- Reporting the p-value lets readers independently interpret results based on their own criteria for "statistically significant."
- This allows direct comparison among studies.
P-Values in Action: A Trading Scenario
Let’s say you’re an investor wondering if your portfolio beats the S&P 500. Your null hypothesis is “my returns are the same as the S&P 500,” and the alternative is “they’re different.” You run a test, and the p-value comes back at 0.001. That’s a 1 in 1,000 chance your results are random—strong evidence to reject the null. Your portfolio’s killing it! You can even use p-values to pit multiple portfolios against each other and spot the odd one out.
What P-Values Don’t Do
P-values are your stats superpower for making sense of data, especially in trading. They help you figure out if patterns—like a winning stock strategy—are real or just luck. Lower p-values mean stronger evidence, but always back it up with more tests. I’ve seen traders use p-values to validate their gut calls, and it’s a total game-changer. Don’t let the math scare you—it’s just a tool to keep you grounded.
Next time you’re analyzing a trade or strategy, don’t skip the p-value check. It’s your ticket to smarter decisions. If this lit up your stats brain, share it with a trading buddy—or hit me up for more number-crunching tips.
For more understanding, detailed articles: P-Value: What It Is, How to Calculate It?
FAQ:
- What is a p-value in trading?
- A p-value is a probability showing how likely your trading data is under the null hypothesis, helping assess if results like stock patterns are significant.
- How is a p-value calculated?
- P-values are computed using statistical software or tables, based on the probability distribution and deviation from the null hypothesis, tailored to the test type.
- What does a low p-value mean for traders?
- A low p-value (e.g., 0.05 or below) suggests strong evidence against the null hypothesis, indicating a trading strategy or result may be valid, not random.
- Can p-values prove a trading strategy works?
- No, p-values don’t prove anything—they show odds of chance. Repeat tests are needed to confirm a strategy’s effectiveness in trading.
- How can beginners use p-values in trading?
- Beginners can use p-values to test portfolio performance against benchmarks, learning to interpret results with practice and software tools.