What is support and resistance?
When I first started right in my trading journey, I learned about support resistance, but I was confused because there were so many support and resistance levels to draw my charts. How do I know when to buy and when to sell? How do I know when support will hold and when it will break?
But after a few years of trial and error, now I can figure things out on my own. I realized how to really trade support resistance levels. So this is why, in this article, I will explain to you right the truth about support and resistance that nobody tells.
You will Learn
- The real support and resistance levels that nobody tells.
- How to draw support and resistance like a pro without cluttering your charts with useless lines.
Support explained
Support is an area on your chart where buying pressure could step in and push the price higher. Let’s see the chart below how this would look like. Now you can see in chart 01 that when the price comes down lower, at some point, it goes up higher, comes down lower, goes up higher, comes down lower, and bounces up higher again.
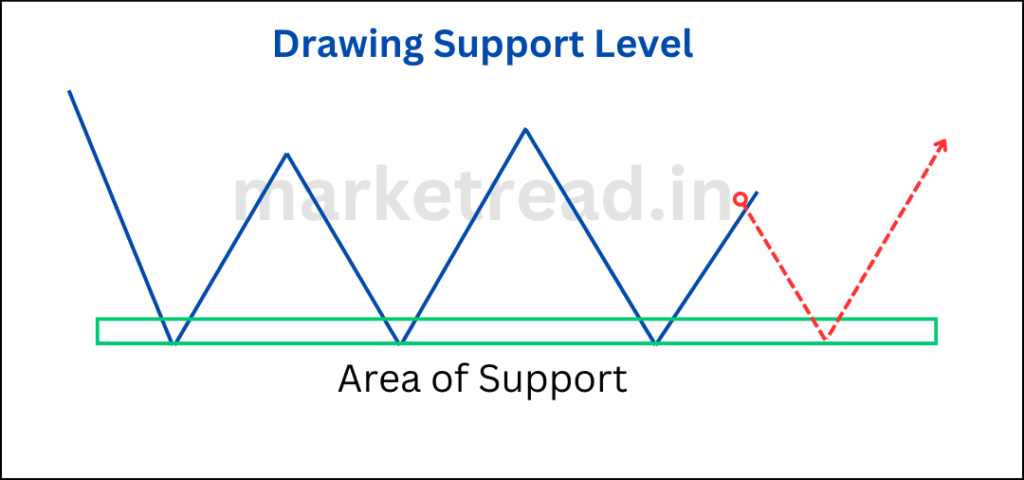
At this point, this is an area of support. Why? Because there’s a possibility if the price comes back down for the next time buying pressure could come in and push the price up higher. This is what we mean by an area on your chart where buying pressure could step in and push the price higher.
Now, why does this happen? The reason is a very simple self-fulfilling prophecy because if enough traders notice this phenomenon, they would expect the price to hold and continue higher.
For example, let’s say stock ABC price comes to the 100 support, bounces up to 200, comes back to 100, bounces up to 300, comes back to 200, comes back to 100, and bounces up to 200. so if enough traders pay attention to this deal thing, this area this 100 right seems to be an interesting place to buy.
Because over the last three times, right stock ABC has bounced off from 10 right and hit higher from there, so if enough traders pay attention to the area on the chart, this becomes a self-fulfilling prophecy. Support becomes an area where buying pressure could step in and push the price up higher.
Resistance explained
As we discussed about support on the opposite we have resistance. This is an area on your chart where selling pressure could come in and push the price lower. You can see this in Chart 02.
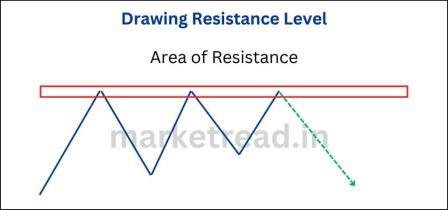
The price goes up higher phase selling pressure comes down lower, again it tries to break out above the highs fair selling pressure comes down lower, re-test a third time phase selling pressure comes down lower.
At this point, we can say that this is an area of resistance on the chart this is an area of resistance because the price has faced difficulty by trying to break out higher, so if it comes back up for a fourth time, this area of resistance could hold selling pressure could step in and push the price lower could step in and make the price up higher.
What if support or resistance breaks?
Many traders ask me this question: what if support or resistance breaks? The simple answer is when support is broken, it could become resistance, and if resistance is broken, it could become support the price.
Let’s see the chart below: price comes out lower, then reverse. Comes down lower, reverses up higher, and again, it comes down. At this reversal point, we can draw an area of support. Then, the third time, it didn’t hold it. Price breaks below support. We can see over here that the previous area of support could now become resistance. Now, this is the point where we can expect selling pressure to come in and push the price down lower.
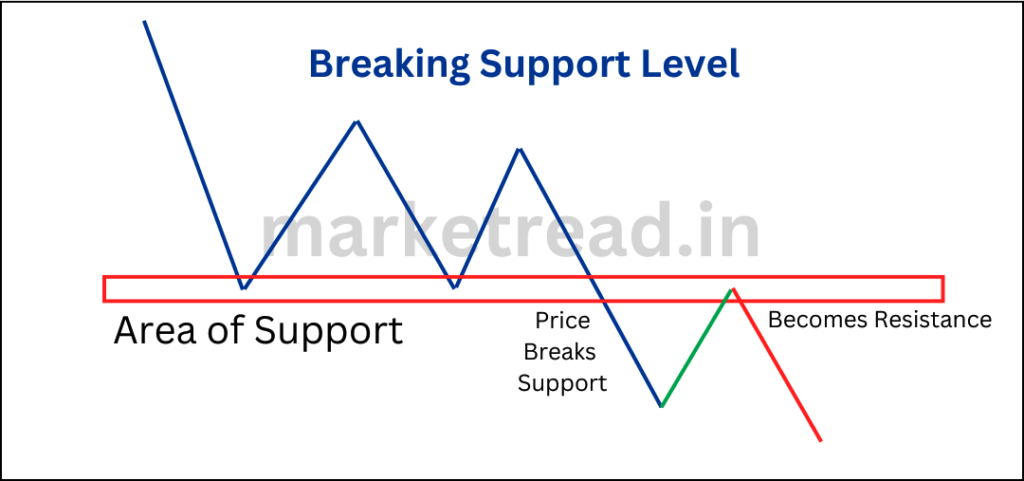
Now, why is this so?
The theory behind this point is that when the price re-tests support for a third time, traders think the price will reverse and bounce up higher from there, so they buy. But then the price kind of didn’t work out the way they expected. The market went against them, and they felt pain as the price hit lower.
Imagine you bought stock of ABC at 100 and the price drops to 90. It keeps dropping until you feel very painful. Then, after some time or after a few days, you see a glimmer of hope. Price starts to reverse up higher and back to your entry point at 100. You finally have gotten out, or rather, your trade has gone back to break even.
So previously, you were losing in the rate very badly, and then hope came back in, and the market went back to the original price which you bought. So, at this point, you tell yourself that’s enough; let me get out of this trade. Let me get rid of the pain. So you sell, you exit that long position.
When you exit the long position, you’re selling that trade at the same price, and when you sell, this creates selling pressure in the market. This is how many people think, and this is how when support is broken, it becomes resistance.
Of course, that’s not the only reason why the price should reverse in that area. Other traders could also be looking at this level and thinking this could be another self-fulfilling prophecy. Many textbooks and courses say that if support is broken, it could become resistant, and then they start to sell in the area. If enough selling pressure is out there, this previous support could become resistance.
How to draw support and resistance?
There are different ways to draw it depending on the market condition. First, let’s discuss drawing support and resistance in a range market.
One – We want to identify the highs and lows of the range.
Identify the extreme highs and lows of the range because this is where you tend to get the strongest reaction when you trade support and resistance. When drawing support and resistance, focus mainly on the key highs and lows of the range. First, identify the key highs and lows at the extreme levels, then adjust them to get the most touches.
Let’s have a look at an example. This is the chart of Tata Motors Ltd’s daily time frame. The upper line is an area of resistance, and the lower line is an area of support.
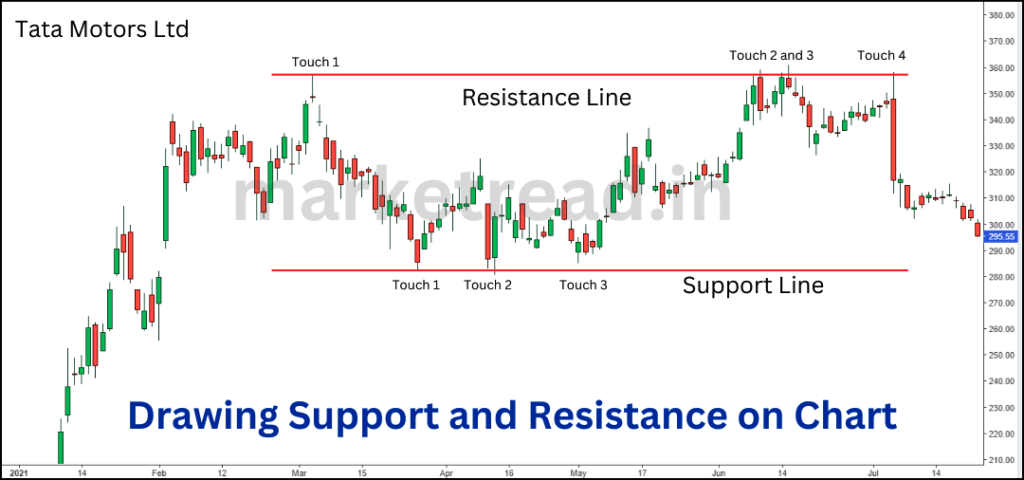
We can see the other highs and lows swing points between these two lines, but these are swing points, not the key support and resistance areas. At the extreme highs and lows, this is where we’ll get the strongest reaction from the market.
Check this also: Gann Calculator
Conclusion
- Support is an area on your chart where buying pressure could step in to push the price higher
- Resistance is an area on your chart where selling pressure could step in to push the price lower.
- When support is broken, it could become resistance, and when resistance is broken, It could become support.
- In the Trending market, pay attention to the two to three more swing points on the chart, and then draw support resistance slash swing high swing lows on the chart.
FAQs
What is support in technical analysis?
Support is an area on your chart where buying pressure could step in and push the price higher. support is a level of price at which it tends to stop falling and either consolidates or rebounds. It is often identified by previous lows in the price chart. Support levels indicate the price where buying interest is strong enough to overcome selling pressure, preventing the price from declining further.
What is resistance in technical analysis?
Resistance is an area on your chart where selling pressure could come in and push the price lower. Resistance is the price level at which a stock or other security tends to stop rising and either consolidates or reverses direction. It is often identified by previous highs in the price chart. Resistance levels indicate the price where selling interest is strong enough to overcome buying pressure, preventing the price from rising further.
How are support and resistance levels determined?
Support and resistance levels are determined by examining historical price data at past price movements with swing highs and lows, where the price has repeatedly reversed direction or consolidated.
Can support and resistance levels change over time?
Yes, support and resistance levels can change over time. As market conditions evolve, new price levels can emerge as significant points of support or resistance. Additionally, once a support level is broken, it can become a new resistance level, and vice versa.
What are some common methods for identifying support and resistance levels?
- Horizontal lines: Drawing lines at previous highs and lows.
- Trendlines: Drawing lines that connect a series of ascending or descending peaks or troughs.
- Moving averages: Using moving averages to identify dynamic support and resistance levels.
- Fibonacci retracement levels: Using Fibonacci ratios to identify potential support and resistance levels.
Can support and resistance be applied to different time frames?
Yes, support and resistance levels can be applied to different time frames, including intraday, daily, weekly, and monthly charts. The significance of these levels may vary depending on the time frame, with longer-term levels generally being more impactful than shorter-term levels.
How can false breakouts be avoided?
False breakouts can be avoided by using confirmation signals. Traders often look for additional indicators, such as increased volume, candlestick patterns, or other technical indicators, to confirm that a breakout is genuine. Waiting for the price to close beyond the support or resistance level can also help avoid false breakouts.



Awesome blog! Is your theme custom made or did you download it from somewhere? A design like yours with a few simple tweeks would really make my blog stand out. Please let me know where you got your design. Appreciate it
F*ckin¦ tremendous issues here. I am very glad to look your post. Thank you so much and i am having a look ahead to contact you. Will you please drop me a mail?