What i Mean Nature and analysis of Candlesticks
I believe that each candlesticks has its unique nature and character. However, it is important to understand this concept thoroughly. Therefore, read the entire article carefully, as I am going to share some very important information here.
Analysis of Candlesticks and How to read candles?
Candlestick charts are a popular tool used in technical analysis to analyze and predict the price movements of a stock. Similarly, a single candlestick is a graph that represents a price movement within a specific time. Basically, It consists of a rectangular body and two thin lines, called shadows or wicks, extending from the top and bottom of the body.
- Each candlestick represents a specific price range and time.
- The shape and color of the candlestick can provide valuable insights into market sentiment and price action.
- Different candlestick patterns can be used to identify potential trading opportunities.
However, many types of candlesticks appear on a chart, but before understanding candlesticks and patterns, let’s first understand how to analyze candlesticks.
Defination of Candlesticks
I have searched many website’s to understand what is the actual defination of candlesticks, and as per investopedia.com they have described it as “Candlesticks are created by up and down movements in the price. While these price movements sometimes appear random, they often form patterns traders use for analysis or trading purposes. Patterns are separated into two categories, bullish and bearish. Bullish patterns indicate that the price is likely to rise, while bearish patterns indicate that the price is likely to fall. No pattern works all the time, as candlestick patterns represent tendencies in price movement, not guarantees.”
Candlesticks analysis
From Candlestick’s Body point of view:
The main thing that we need to understand that how candlesticks formation works. The body of a candlestick is the thickest part and represents the range between the open and close prices of the stock during the specified time.
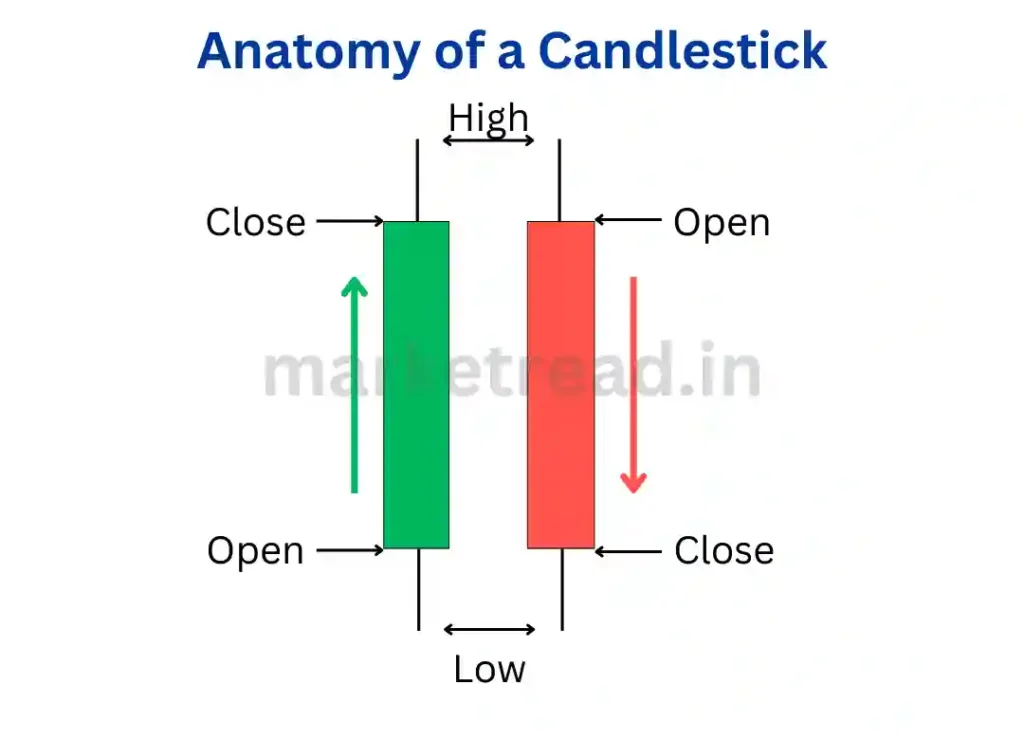
A Bullish Candlestick appears green or white on the chart. It means the price opens at a lower level and closes at a higher. It indicates buying sentiments or bullishness in the market.
A Bearish Candlestick appears red or black on the chart. It means the price opens at a higher level and closes at a lower. It indicates selling sentiments or bearishness in the market.
From Candlestick Wick’s point of view
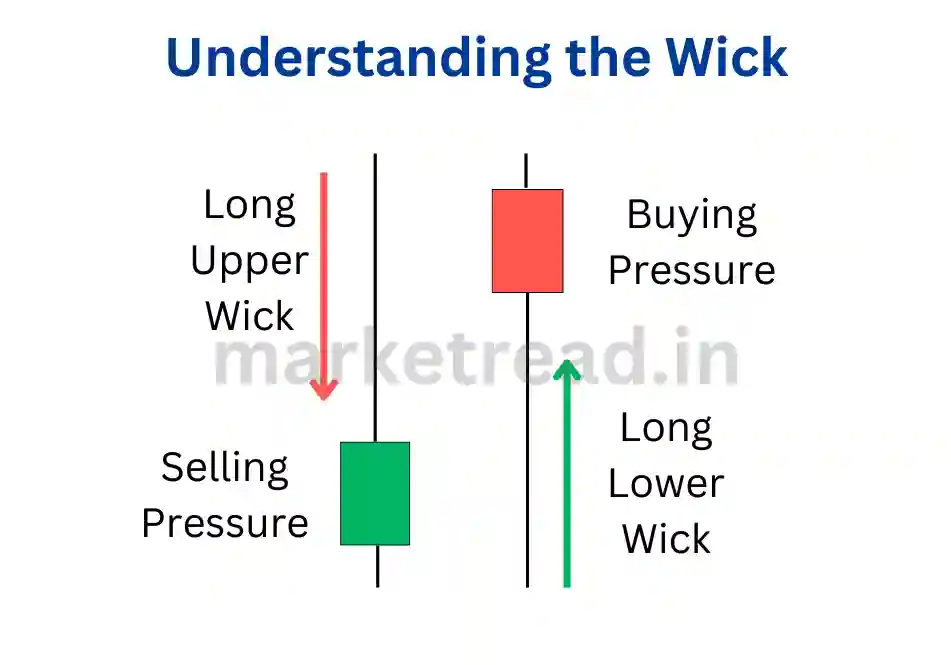
The line that appears on the top or bottom of the body of the candlestick is called a wick or shadow. It is the thin line that extends above and below the body of the candlestick. It represents the highest and lowest price movement during the time.
- Upper Wick: The upper wick shows the highest price reached during the period.
- Lower Wick: The lower wick shows the lowest price reached during the period.
Understanding the Wick in Candlesticks
The market is a game of numbers. A trader has to keep an eye on the statistics every moment. But not everyone can conclude by reading all those numbers, all the data, doing mathematical processes on them, and analyzing them.
In the old days, some people used to do this mathematical process. But in today’s world, it is not possible to do so. And that is why candlesticks were introduced in the market.
Understanding the structure and nature of candlesticks makes it easier for us to understand the market condition.
Candlesticks are of great importance in technical analysis. By analyzing candlesticks, we can guess which way the market is headed. This allows us to understand the mindset of investors in the market.
Psychology also says that human behaviour is always repeated.
So, whatever patterns are being formed in the market, whatever candlesticks are being formed, they actually reflect the mindset and behaviour of that group of people.
Therefore, to become a skilled trader, it is important to know the structure and nature of candlesticks.
The Nature of Candlesticks
We know that a candlestick is made up of a body, a wick or a shadow. These help us to understand buying and selling pressure of a stock. But have we ever tried to understand the nature of a candlestick? Let’s understand the Nature of Candlesticks in different aspects.
Impact of Timeframe
Just like humans have different natures fickle, stable and confused, candlesticks also have different natures. These nature of candlesticks depend on the timeframe we choose and in which the candlesticks are formed.
Day traders look at 3-minute, 5-minute, or 15-minute candlesticks. These candlesticks have a volatile and unstable nature. Therefore, day traders need to make quick decisions.
Swing Trading and Positional Trading
Swing traders and positional traders look at hourly, daily, and monthly candlesticks. These candlesticks have a stable nature.
Volatile Candlesticks
As the timeframe decreases, the nature of the candlestick becomes more volatile. It is important to make quick decisions when trading in a volatile market.
Stable Candlesticks
As the timeframe increases, the nature of the candlestick becomes more stable. It is important to be patient when trading in a stable market.
Candlestick Formation
The formation of a candlestick reflects its nature. However, the nature of a candlestick is also influenced by the level at which it is formed.
Understanding the formation, nature, and level of a candlestick helps us to understand the forces that control the market. This information can help us to develop successful trading strategies.
Now let’s understand this properly:
- The shorter the timeframe we choose, the more volatile and unstable the candlestick’s nature becomes.
- Conversely, as we increase the timeframe, the nature of the candlestick becomes more stable.
For example:
- If we are day traders and we look at 3 or 5-minute candlesticks, we need to keep in mind that we are trading in a volatile market and we need to make decisions quickly.
- When someone is able to remain stable and make decisions with a stable mindset in such a volatile situation, the chances of that decision being correct are higher.
Download Here Candlestic Patterns PDF: Candlesticks Pattern Cheat Sheet
Conclusion
The composition of a candlestick does reflect its personality, but we have also seen many times that even after looking at a candlestick, we take a trade, and yet our trade does not go in our favour.
This also happens because we know the composition of the candlestick, but the level at which that candlestick is forming affects its personality. Therefore, it is important to have a good understanding of the composition, personality, and level of the candlestick. This will help us understand who is in control of the market and what the next situation in the market can be.
By practising candlesticks, we can develop our strategies and become successful traders by understanding their signals.
FAQs
What are the 4 parts of a candlestick?
Open Price, High Price, Low Price, Close Price. Where the wick represents the high and low point of price, and the candle’s body is formed using the exact open and closed price.
What is the structure of a candlestick?
Basically, every candlestick has mainly three parts: Real Body, Upper Wick, and Lower Wick.
How many candlesticks are in trading?
As per the information available on Wikipedia, There are 42 recognized patterns that can be split into simple and complex patterns.


Way cool, some valid points! I appreciate you making this article available, the rest of the site is also high quality. Have a fun.