How the 5-Minute Scalping Breakout Strategy Works (Clarix)
5-Minute Scalping Breakout Strategy: The code given below is written in Pine Script of TradingView, which uses scalping breakout strategy for 5 minute timeframe. This script shows premium, discount, and equilibrium zones, which show important price levels. User can set take profit and stop loss values in pips, and all calculations are done automatically. User can set the time to start trading (start hour and minute).
Understanding the Premium, Discount, and Equilibrium Zones
This script captures high and low in every 15-minute cycle, because this strategy tracks market breakout. For buy signal, close price should be higher than the highest price of the last 15 minutes and it should be in buying zone (below discount or equilibrium). For sell signal, close price should be lower than the lowest price of the last 15 minutes and it should be in selling zone (above premium or equilibrium). These signals are also visualized on the chart by shapes (triangle up/down).
Initially, zones are drawn on the chart—premium is the top of the chart, discount is the bottom of the chart, and equilibrium is the middle. The colors of the zones can be customized by the user. All of these zones are drawn on the chart using box objects, and updated to reflect their current state using bar indexes.
How Signals Are Generated
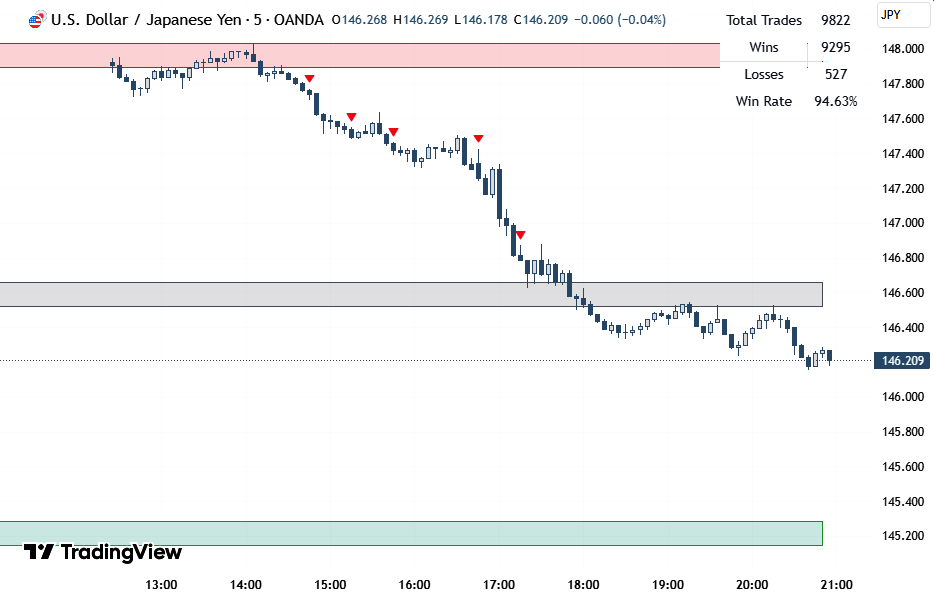
The script also contains trade execution logic; when a signal is generated, it takes the entry price, determines the direction ("Buy" or "Sell"), and tracks the trade once it starts. A "Win" result is given when the high price reaches the take profit, or a "Fail" result is given when the low price reaches the stop loss. Once the trade results are tracked, the trade table and stats table are updated—the total number of trades, how many wins, how many losses, and what the win rate are—all of this is visible on the chart in the live stats.
The script also has alerts that are compatible with TradingView's alert system, so you can get notified immediately when a buy/sell signal arrives. The table shows the time, direction, result, and entry price of the trade, and the stats table shows the overall performance. The whole setup for visualization is perfect, and the code is also easy to manage because the variables are initialized properly.
This script is mainly written for 5m scalping where you get quick breakout signals and know the profit or loss immediately. If you are trading in forex market or any fast moving market, then this code will be very useful. Features like box, table, and alert make your chart visually effective and help in decision-making.
Conclusion
If you're serious about short-term trading, the 5-Minute Scalping Breakout Strategy gives you the tools to react fast, trade smart, and analyze instantly. Now it’s your turn load it up, backtest it, and start refining your edge.
//@version=6
indicator("Clarix 5m Scalping Breakout Strategy", overlay=true)
pip_size = 0.0001
tp_pips = input.float(3, "Take Profit (pips)", minval=0.1)
sl_pips = input.float(45, "Stop Loss (pips)", minval=0.1)
take_profit = tp_pips * pip_size
stop_loss = sl_pips * pip_size
start_hour = input.int(0, "Start Hour (GMT+3)", minval=0, maxval=23)
start_minute = input.int(0, "Start Minute (GMT+3)", minval=0, maxval=59)
start_of_day = timestamp("GMT+3", year, month, dayofmonth, start_hour, start_minute)
minutes_from_day_start = (time - start_of_day) / 60000
fivemin_index = math.floor(minutes_from_day_start / 5)
cycle_index = fivemin_index % 6
var float last_15m_high = na
var float last_15m_low = na
if cycle_index == 0
    last_15m_high := high
    last_15m_low := low
else if cycle_index < 3
    last_15m_high := math.max(last_15m_high, high)
    last_15m_low := math.min(last_15m_low, low)
monitoring = (cycle_index >= 3) and (cycle_index <= 5)
var bool signal_fired_this_cycle = false
if cycle_index == 0
    signal_fired_this_cycle := false
zone_bars_fixed = 500
show_zones = input.bool(true, "Show Premium/Discount Zones")
premium_color = input.color(color.new(color.red, 85), "Premium Zone Color")
discount_color = input.color(color.new(color.green, 85), "Discount Zone Color")
equilibrium_color = input.color(color.new(color.gray, 85), "Equilibrium Zone Color")
top = ta.highest(high, zone_bars_fixed)
bottom = ta.lowest(low, zone_bars_fixed)
eq_top = 0.525 * top + 0.475 * bottom
eq_bottom = 0.525 * bottom + 0.475 * top
eq_range = eq_top - eq_bottom
below_50pct_equilibrium = close < eq_bottom - 0.5 * eq_range
above_50pct_equilibrium = close > eq_top + 0.5 * eq_range
below_equilibrium = close < eq_bottom
above_equilibrium = close > eq_top
inside_equilibrium = (close >= eq_bottom) and (close <= eq_top)
var box premium_box = na
var box eq_box = na
var box discount_box = na
if show_zones
    if barstate.islastconfirmedhistory
        if not na(premium_box)
            box.delete(premium_box)
        if not na(eq_box)
            box.delete(eq_box)
        if not na(discount_box)
            box.delete(discount_box)
        premium_box := box.new(left=bar_index - zone_bars_fixed, right=bar_index, top=top, bottom=0.95 * top + 0.05 * bottom, bgcolor=premium_color, border_color=color.red)
        eq_box := box.new(left=bar_index - zone_bars_fixed, right=bar_index, top=eq_top, bottom=eq_bottom, bgcolor=equilibrium_color, border_color=color.gray)
        discount_box := box.new(left=bar_index - zone_bars_fixed, right=bar_index, top=0.95 * bottom + 0.05 * top, bottom=bottom, bgcolor=discount_color, border_color=color.green)
buy_signal_raw = monitoring and not signal_fired_this_cycle and close > last_15m_high and close[1] <= last_15m_high and below_equilibrium and below_50pct_equilibrium
sell_signal_raw = monitoring and not signal_fired_this_cycle and close < last_15m_low and close[1] >= last_15m_low and above_equilibrium and above_50pct_equilibrium
if buy_signal_raw or sell_signal_raw
    signal_fired_this_cycle := true
var bool buy_signal_next = false
var bool sell_signal_next = false
buy_signal = buy_signal_next
sell_signal = sell_signal_next
buy_signal_next := buy_signal_raw
sell_signal_next := sell_signal_raw
plotshape(buy_signal_raw, title="Buy Signal", location=location.belowbar, style=shape.triangleup, color=color.green, size=size.tiny)
plotshape(sell_signal_raw, title="Sell Signal", location=location.abovebar, style=shape.triangledown, color=color.red, size=size.tiny)
show_table = input.bool(false, "Show Trade Table")
var table resultTable = show_table ? table.new(position.top_right, 4, 10, border_width=1) : na
var int row = 0
var bool in_trade = false
var float entry_price = na
var string direction = ""
var string result = ""
var int trade_start_bar = na
if buy_signal and not in_trade
    entry_price := open
    direction := "Buy"
    in_trade := true
    result := "Waiting"
    trade_start_bar := bar_index
if sell_signal and not in_trade
    entry_price := open
    direction := "Sell"
    in_trade := true
    result := "Waiting"
    trade_start_bar := bar_index
if in_trade
    if direction == "Buy"
        if high >= entry_price + take_profit
            result := "Win"
            in_trade := false
        else if low <= entry_price - stop_loss
            result := "Fail"
            in_trade := false
    if direction == "Sell"
        if low <= entry_price - take_profit
            result := "Win"
            in_trade := false
        else if high >= entry_price + stop_loss
            result := "Fail"
            in_trade := false
if show_table and not in_trade and result != "Waiting"
    time_in_gmt3 = time + 3 * 3600000
    formatted_time = str.format("{0,date,yyyy-MM-dd HH:mm}", time_in_gmt3)
    table.cell(resultTable, 0, row, formatted_time, text_color=color.black)
    table.cell(resultTable, 1, row, direction, text_color=color.black)
    table.cell(resultTable, 2, row, str.tostring(result), text_color=result == "Win" ? color.green : color.red)
    table.cell(resultTable, 3, row, str.tostring(entry_price, format.mintick), text_color=color.black)
    row := (row + 1) % 10
var int wins = 0
var int losses = 0
if not in_trade and result != "Waiting"
    if result == "Win"
        wins += 1
    else if result == "Fail"
        losses += 1
total = wins + losses
win_rate = total > 0 ? (wins * 100.0) / total : na
var table statsTable = table.new(position.top_right, 2, 4, border_width=1)
if bar_index % 5 == 0
    table.cell(statsTable, 0, 0, "Total Trades", text_color=color.black, bgcolor=color.white)
    table.cell(statsTable, 1, 0, str.tostring(total), text_color=color.black, bgcolor=color.white)
    table.cell(statsTable, 0, 1, "Wins", text_color=color.black, bgcolor=color.white)
    table.cell(statsTable, 1, 1, str.tostring(wins), text_color=color.black, bgcolor=color.white)
    table.cell(statsTable, 0, 2, "Losses", text_color=color.black, bgcolor=color.white)
    table.cell(statsTable, 1, 2, str.tostring(losses), text_color=color.black, bgcolor=color.white)
    table.cell(statsTable, 0, 3, "Win Rate", text_color=color.black, bgcolor=color.white)
    table.cell(statsTable, 1, 3, str.tostring(win_rate, "#.##") + "%", text_color=color.black, bgcolor=color.white)
plotshape(not in_trade and result == "Fail" and bar_index == trade_start_bar, title="Failed Entry Marker", location=location.abovebar, color=color.red, style=shape.circle, size=size.small)
alertcondition(buy_signal_raw, title="Buy Alert", message="📈 Buy signal detected on {{ticker}} at price: {{close}}")
alertcondition(sell_signal_raw, title="Sell Alert", message="📉 Sell signal detected on {{ticker}} at price: {{close}}")
Get Started with This Script
Check out the live Pine Script on TradingView
Created by: CLARIX_WEALTH
Open-source: Fully transparent—review, copy, or adapt it to your own trading rules.
Disclaimer: This script and its usage do not constitute financial or investment advice. Always trade responsibly and test before going live.